July 18, 2022

Market Tunnel Vision
Zooming out and looking at the real estate market over the last 20 years can help put the recent market trends into perspective. Some trends repeat annually and we can even analyze the market reaction to the last crash in 2008 since there have been many debates about the next market crash or bubble pop.
How Listing Volume Affects The Market
By understanding these historical market trends, sellers and buyers can make informed decisions. Pricing and inventory are often tied together in some fashion since they directly relate to the supply and demand curves (less supply drives higher prices as demand rises, and vice-versa).
For sellers, it's important to know if prices are rising or falling. If prices are rising with low inventory, it may be an opportune time to sell.
For buyers, it's important to know how much inventory is on the market. If there is a large volume of inventory, the competition for a property should be less and resulting in a favorable transaction for the buyer in the form of price or contingencies.
By understanding the historical market trends, sellers and buyers can make informed decisions about when to buy or sell.
Massachusetts: A 20-Year View
Annual Trends
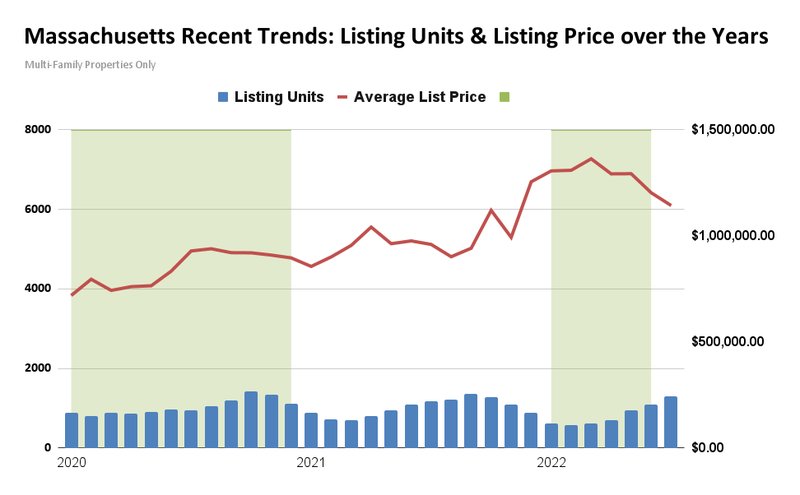
Over an expansive period in the real estate market, it becomes easier to see trends over the annual cycle while you can avoid the "noise". Listing inventory commonly decreases in the winter and climbs over time hitting a local peak in the summer of each year. Besides major market changes (market crash in 2008 and leading years) this trend seems to be a constant. Looking at a zoomed-in picture, this trend is very apparent even with the historically low listing volumes that have recently been a key factor in the rapid rise in list price.
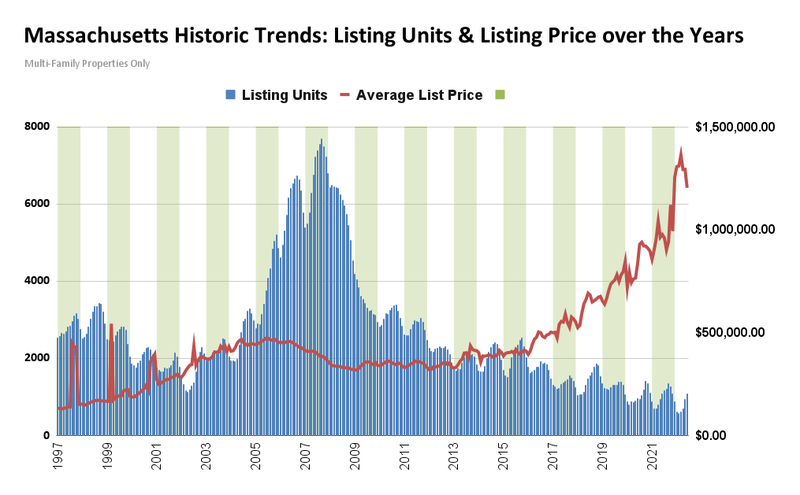
Supply vs Demand
Since around 2013, the trends between inventory (Listing Units) and price (Average List Price) clearly show that drastic price increases have occurred as the available inventory on the market has diminished. While various variables go into housing prices (e.g. inflation, rent cost, building cost, zoning, job availability, etc) the listing inventory seems to be the main attributor to the recent price spike or what many have defined as a "bubble".
Between 2021 and 2022 there has been a sharp price increase, however, based on the recent data the price is starting to decline? Will this continue as rates have almost doubled across the country (~5-6% 30-year fixed)? Long term this trend will continue until cities and states can promote the development of more properties.
Recent

Multi Family Market Updates - October
Oct. 26, 2022

Massachusetts Market Update - September
Oct. 12, 2022

Comments