Oct. 11, 2022

Estimating Cap Rates
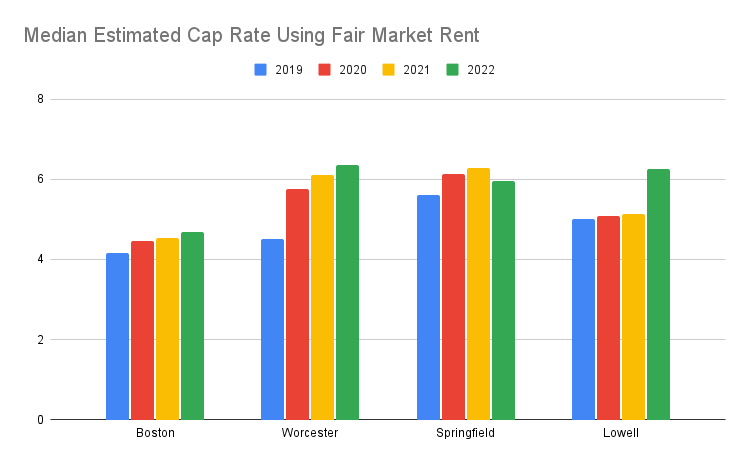
Estimating Cap Rates of Major Multi-Family Markets
In the past I've used bots to quickly calculate estimations of the well known 1% rule for all new properties that hit the MLS and that were sent from my real estate agent to my email. I did this to not waste my time on properties that made no sense to look at and save my time.
I took this idea to generate this data, but with a bit larger scale! This data comes from all MLS sold properties for these 4 cities over the last 4 years. That being said, the data isn't perfect. If you've seen a lot of MLS listings, you will know to almost never trust how accurate some information added into the listing is. One of those major pieces used to calculate a cap rate is the rent role. To remedy this issue I assume the values given in the Department of Housing and Urban Development (HUD) fair market rents (FMR). These rents can be used by investors to get a quick idea of what you can get for rent, but usually on the lower end, especially in a market with lower volumes (Massachusetts).
Assumptions:
Rent = HUD Fair Market Rents
Electricity =$50/unit
Water/Sewer = $50/bedroom
Insurance = $150/Unit
Repairs = 5% Rents
Management = 10% Rents
Vacancy = 5% Rents
Disclaimer:
Of course every property should be analyzed individually and the values I used above will never be accurate for everything. Using this wag you can see relative trends in cap rate of these 4 major cities based on the changes in price and rent over the years.
Recent

Multi Family Market Updates - October
Oct. 26, 2022

Massachusetts Market Update - September
Oct. 12, 2022

Comments